Are you ready to take your data visualization skills to the next level? Dive into the world of stacked column chart with us as we explore their benefits, best practices, real-life examples, and more! Whether you’re a data enthusiast or a business professional looking to make impactful presentations, understanding stacked column charts can revolutionize how you communicate information effectively. Let’s embark on this insightful journey together!
What is a stacked column chart?
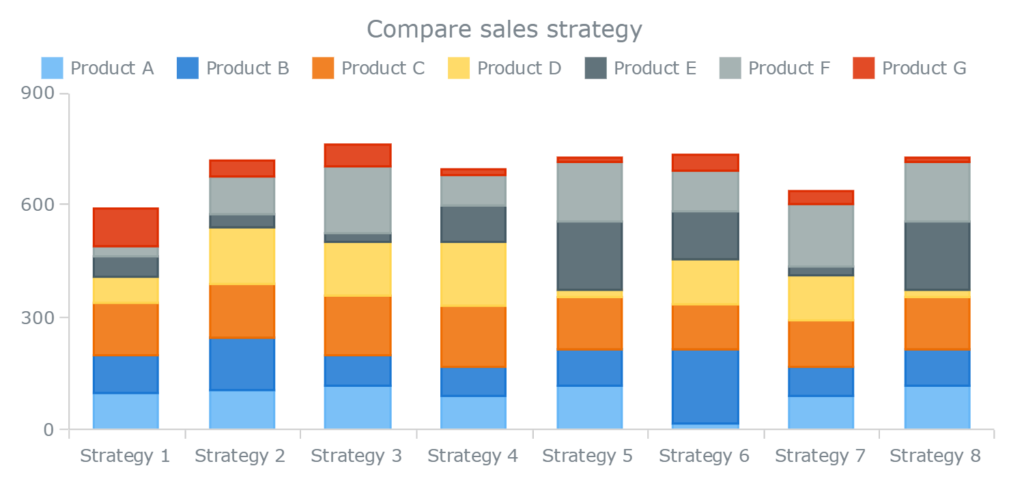
A stacked column chart is a powerful data visualization tool that displays multiple series of data in vertical columns. Each column represents a different category, with the height of the column indicating the total value for that category. What sets stacked column charts apart is their ability to show not only individual values but also how they contribute to the whole.
By stacking additional series on top of one another, this chart type allows for easy comparison between different categories and trends over time. The segments within each column are color-coded for quick identification, making it visually appealing and intuitive to interpret complex datasets at a glance.
Whether you’re analyzing sales figures, survey responses, or any other dataset with multiple variables, stacked column charts offer a clear and concise way to present your information effectively.
History and evolution of stacked column charts
Stacked column charts have a rich history that dates back to the early days of data visualization. The concept of stacking columns to showcase multiple data sets in a single chart has evolved over time with advancements in technology and design principles.
Initially, stacked column charts were used primarily in print media to present complex information in a visually appealing manner. As digital tools became more sophisticated, the versatility and accessibility of stacked column charts increased, making them popular across various industries.
Over the years, designers and developers have refined the aesthetics and functionality of stacked column charts, enhancing their ability to communicate data effectively. Today, these charts are widely utilized in business presentations, reports, dashboards, and online platforms for easy comprehension of trends and comparisons.
The evolution of stacked column charts mirrors the progress of data visualization as a whole – constantly adapting to meet the changing needs and preferences of users seeking insightful ways to interpret information visually.
Why use a stacked column chart?
Stacked column charts are a popular choice for visualizing data because they allow you to compare both the total value of each category and the composition of that total. By stacking segments on top of each other, these charts provide a clear picture of how individual parts contribute to the whole.
This type of chart is particularly useful when you want to show not only trends over time but also how different factors influence those trends. For example, in sales data analysis, stacked column charts can help identify which product categories drive overall revenue growth or decline.
Moreover, using colors to differentiate between segments makes it easy for viewers to quickly grasp the information presented. This visual aid enhances understanding and facilitates decision-making based on insights derived from the data displayed in the chart.
How to create a stacked column chart
Creating a stacked column chart is a straightforward process that can visually represent data in a comprehensive manner. To start, you will need to gather the necessary data that you want to showcase in your chart. This could include sales figures, survey results, or any other relevant information.
Next, open up a spreadsheet program like Microsoft Excel or Google Sheets. Input your data into columns and rows within the spreadsheet interface. Make sure to organize your data clearly so that it aligns with how you want it displayed in the stacked column chart.
Once your data is properly formatted in the spreadsheet, select the cells containing the data you want to include in the chart. Then navigate to the “Insert” tab and choose “Stacked Column Chart” from the options available. Customize your chart by adjusting colors, labels, and titles to enhance its visual appeal and clarity.
After customizing your stacked column chart according to your preferences, save or export it for use in presentations or reports as needed. Voila! You’ve successfully created a visually impactful representation of your data using a stacked column chart.
Best practices for using a stacked column chart
When utilizing a stacked column chart, it’s essential to keep the design clean and uncluttered. Limit the number of categories or data series to ensure clarity for the audience. Use contrasting colors to differentiate between each segment effectively.
Ensure that your data is organized logically from largest to smallest segments or in a meaningful order that tells a coherent story. This arrangement helps viewers easily grasp the key insights being conveyed by the chart.
Label both axes clearly and provide a concise but informative title that summarizes the main takeaway of the chart. Utilize legends if necessary, but avoid overcrowding with unnecessary details.
Consider adding annotations or callouts to highlight specific data points or trends that you want your audience to focus on. These additional elements can enhance understanding and engagement with your stacked column chart.
Real-life examples of the usefulness of stacked column charts
Have you ever wondered how businesses make crucial decisions based on data? Stacked column charts play a vital role in visualizing complex information in an easily digestible format. For instance, imagine a retail company analyzing sales performance across different product categories over several quarters.
By using a stacked column chart, the management can quickly identify trends, spot areas of growth or decline, and allocate resources effectively. Similarly, in healthcare settings, hospitals can utilize stacked column charts to compare patient satisfaction scores for various departments and track improvements over time.
Moreover, marketing teams can leverage these charts to evaluate the success of different advertising campaigns by comparing click-through rates or conversion metrics. This visualization tool enables professionals to uncover insights that drive strategic decision-making and enhance overall performance.
Limitations and alternatives to stacked column charts
When it comes to stacked column charts, there are a few limitations to keep in mind. One limitation is that as the number of categories or data series grows, the chart can become visually cluttered and harder to interpret. Another drawback is that it might be challenging to compare individual values within each stack accurately.
An alternative to stacked column charts could be using clustered column charts if you need a clearer comparison between individual data points within each category. Alternatively, a stacked bar chart can also be used if horizontal space is limited and you want to display the data vertically.
It’s essential to consider the specific requirements of your data visualization project before deciding on the best chart type. Experimenting with different chart styles can help determine which one effectively communicates your message without sacrificing clarity or accuracy.
Conclusion
Stacked column charts are powerful tools that visually represent data in a clear and organized manner. They offer a comprehensive way to compare multiple categories within each group, making it easier to identify trends, patterns, and relationships in the data. By understanding how to create and effectively use stacked column charts, individuals and businesses can make informed decisions based on insightful data visualization. Whether you’re analyzing sales figures, tracking project progress, or presenting survey results, stacked column charts can enhance your data analysis capabilities and help you communicate information more effectively. Embrace the benefits of stacked column charts in your work to unlock valuable insights and drive better decision-making processes.


More Stories
utilete: The Key to Unlocking Your Potential
A Comprehensive Guide to StudentVue CCBOE
Deciles: A Guide to Creating Lasting Memories